


VTK Files in Mayavi
Mayavi is a 3D data visualisation tool. It's very handy for making nice plots of various scientific data. This page describes two approaches for using Mayavi for displaying data generated outside the Mayavi API. The first uses a basic 'serial' file format, the second is a more up-to-date XML file format.
VTK Files
A simple approach to importing data into Mayavi is to use the VTK file format, which can be written in ASCII. The VTK file formats are described fully in this document. An example data file is show below. Note: This is a legacy format and the VTK file reader can be slightly troublesome if there are formatting errors in your file. The XML format described next is preferred.
simple.vtk# vtk DataFile Version 2.0 Simple VTK file example ASCII DATASET POLYDATA POINTS 9 float 3.0 0.0 0.0 1.0 1.0 0.0 0.0 3.0 0.0 3.0 0.0 1.0 1.0 1.0 1.0 0.0 3.0 1.0 3.0 2.0 2.0 2.0 2.0 2.0 2.0 3.0 2.0 TRIANGLE_STRIPS 2 14 6 0 3 1 4 2 5 6 3 6 4 7 5 8 POINT_DATA 9 SCALARS nodal float LOOKUP_TABLE default 0.0 0.1 0.0 0.3 0.6 0.3 0.8 1.0 0.8
The first three lines just specify the file format, a title for the data and the data format, in this case ASCII (it can also be binary). Next
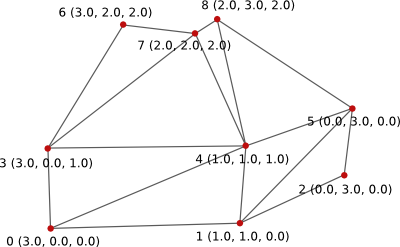
the actual data points are given. In this case there are 9 points of type float. Each point is given in X,Y,Z format.
The right hand image below shows the index and coordinates of the 9 data points.
Triangle Strip, showing point ordering |
Simple Shape made from two triangle strips |
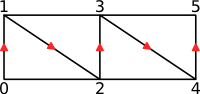
The next section specifies how these points are connected. In this example two triangle-strips are used. The point ordering for a 6 point strip is shown in the left hand image above. Each strip is called a cell, there are various different cell formats. See the VTK File Formats Document for more info.
The first line specifies the type of cell (TRIANGLE_STRIPS), the number of cells and total number of cell data values.
The basic format is one line per cell. The first integer specifies the number of points in the strip, the following points
specify the point index (as determined by the order in the DATASET section.
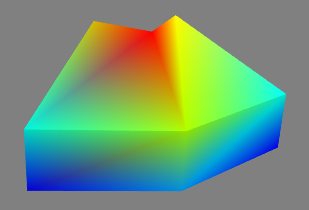
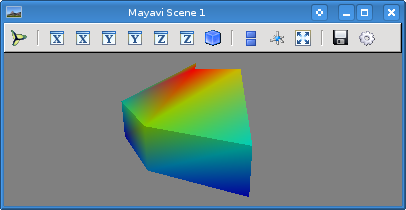
The final section specifies a data value for each point, this translates to a point colour. A rendered version of the data using this colour information is shown below. The colour is interpolated between points. The default data value range is 0.0 to 1.0.
VTK XML Files
The VTK XML file format is slightly more complex, but is more up-to-date and preferred over the basic legacy 'serial' format. An example XML file is given below. The data is visualised using two polygons (triangles) and one triangle strip.
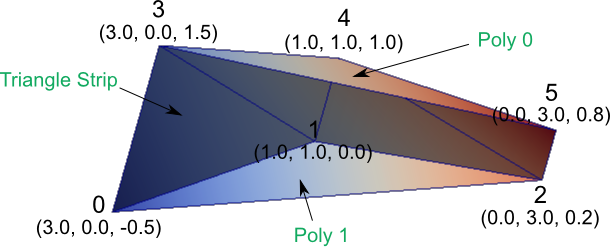
The image above shows the coordinates and index of the 6 data points.
simpleXML.vtp<?xml version="1.0"?> <VTKFile type="PolyData" version="0.1" byte_order="LittleEndian"> <PolyData> <Piece NumberOfPoints="6" NumberOfVerts="0" NumberOfLines="0" NumberOfStrips="1" NumberOfPolys="2"> <Points> <DataArray type="Float32" NumberOfComponents="3" format="ascii"> 3.0 0.0 -0.5 1.0 1.0 0.0 0.0 3.0 0.2 3.0 0.0 1.5 1.0 1.0 1.0 0.0 3.0 0.8 </DataArray> </Points> <PointData Scalars="my_scalars"> <DataArray type="Float32" Name="my_scalars" format="ascii"> 0.0 0.4 0.8 0.2 0.6 1.0 </DataArray> </PointData> <Strips> <DataArray type="Int32" Name="connectivity" format="ascii"> 0 3 1 4 2 5 </DataArray> <DataArray type="Int32" Name="offsets" format="ascii"> 6 </DataArray> </Strips> <Polys> <DataArray type="Int32" Name="connectivity" format="ascii"> 0 1 2 3 4 5 </DataArray> <DataArray type="Int32" Name="offsets" format="ascii"> 3 6 </DataArray> </Polys> </Piece> </PolyData> </VTKFile>
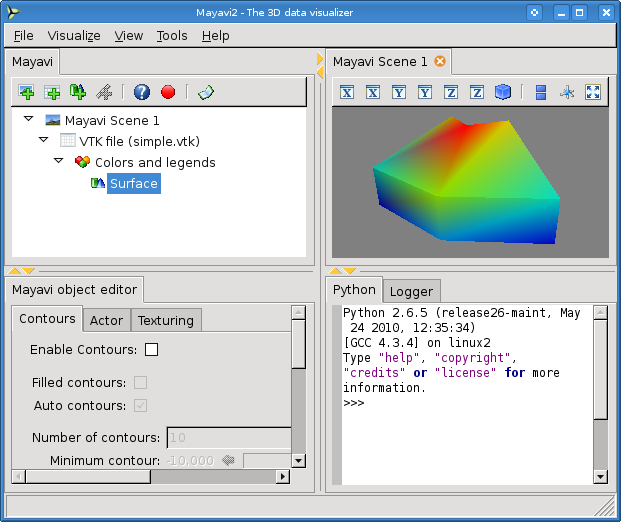
Using the Mayavi GUI
Having started the Mayavi GUI, follow the steps below to visualise the data from simple.vtk
- Select
File→Load data→Open file - Select the
simple.vtkfile - Select
Visualize→Modules→Surface
You can now look around the 3D visualisation by using the mouse. A screen shot of Mayavi with the loaded data is shown below.
Using Python
It can be quite tedious to use the GUI to display data. The python script below will load a VTK file and display the 3D view.
display.pyimport os from enthought.mayavi.core.api import Engine from enthought.mayavi.sources.vtk_file_reader import VTKFileReader from enthought.mayavi.modules.surface import Surface vtkFile = 'simple.vtk' # Create the MayaVi engine and start it. engine = Engine() engine.start() scene = engine.new_scene() # Read in VTK file and add as source reader = VTKFileReader() reader.initialize(vtkFile) engine.add_source(reader) # Add Surface Module surface = Surface() engine.add_module(surface) # Move the camera scene.scene.camera.elevation(-70) # Save scene to image file scene.scene.save_png('image.png') # Create a GUI instance and start the event loop. # This stops the window from closing from enthought.pyface.api import GUI gui = GUI() gui.start_event_loop()
Run the script using the command below. The output is shown
> python display.py
If you have an XML file, make the following changes:
#from enthought.mayavi.sources.vtk_file_reader import VTKFileReader
from enthought.mayavi.sources.api import VTKXMLFileReader

#vtkFile = 'simple.vtk'
vtkFile = 'simpleXML.vtp'

#reader = VTKFileReader()
reader = VTKXMLFileReader()
Auto Visualisation Update
To make things even easier, the following script loads a VTK file and then periodically checks for changes. If the file is updated, the 3D visualisation is also updated.
Run the script and try editing the data point values in the simple.vtk file. When the file is saved, the 3D
visualisation will automatically update.
updater.pyimport os from enthought.pyface.timer.api import Timer from enthought.mayavi.core.api import Engine from enthought.mayavi.sources.vtk_file_reader import VTKFileReader from enthought.mayavi.modules.surface import Surface vtkFile = 'simple.vtk' # Create the MayaVi engine and start it. engine = Engine() engine.start() scene = engine.new_scene() # Read in VTK file and add as source reader = VTKFileReader() reader.initialize(vtkFile) engine.add_source(reader) # Add Surface Module surface = Surface() engine.add_module(surface) # Update class class Updater(object): def __init__(self, filename, reader): self.filename = filename self.reader = reader self.mod_time = os.stat(filename).st_mtime def test_file(self): mod_time = os.stat(self.filename).st_mtime if self.mod_time == mod_time: return print "Data File Changed" self.mod_time = mod_time reader = self.reader reader.reader.modified() reader.update() # Create Updater updater = Updater(vtkFile, reader) timer = Timer(500, updater.test_file) # Create a GUI instance and start the event loop. # This stops the window from closing from enthought.pyface.api import GUI gui = GUI() gui.start_event_loop()
