


Gnuplot
Gnuplot is an excellent free tool for plotting graphs. This page is just a collection of techniques I use regularly. The links section has suggestions for other, more comprehensive gnuplot sites.
Links
There are many good gnuplot websites. Below is a list of some that contain useful information
Styles
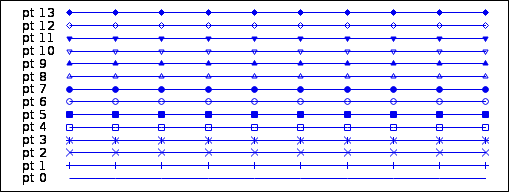
Gnuplot Point Styles
Heatmap Plots
The simplest method for creating a heatmap is to organise your data in a list of x,y,z values. The x and Y values are the positions in the heatmap. The z value will set the colour of the block at the x,y coordinate. A snippet of a data file is shown below. The first data value line defines a point at x,y = -15,11 with a data value of 0.020394. Note that the x,y values do not need to be integers.
map.dat... -15 11 0.020394 -15 12 0.015745 -15 13 0.011885 -15 14 0.008771 -15 15 0.006330 -14 -15 0.008771 -14 -14 0.012155 -14 -13 0.016469 -14 -12 0.021818 ...
Using the complete data file heatmap.dat, the heatmap can be plotted using the following gnuplot command.
plot 'heatmap.dat' u 1:2:3 with image
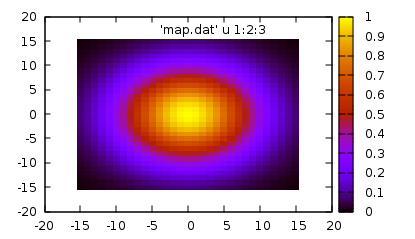
Heatmap created with Gnuplot
